


Up c25% ytd (although flat vs. SPY), financials are breaking out into new high ground. We are reminded of the sector's early market cycle positioning (financials peak and bottom before the broader market; although a late earnings cycle play). Coming close on the heels of a breakout on the broader market indices, these are positives sign for the market. Specifically, we see positive absolute, relative and rotational trends backed by similar set ups in major banks, investment banks. Even the Regionals are joining the party. While the rotation into tech is still in early stages, the opportunity in financials is here and now.
- Absolute Performance - Breaking Out (fig 1) - XLF's breakout above 46, into new high ground, comes after a near 2-month consolidation. Momentum, volume and trend indicators are supportive of the breakout.
- Outperformance to the Fore (fig 2) - While financials have matched broad market performance ytd, recent trends have been challenging - these are now getting reversed. A possible head and shoulders top (XLF relative to SPY) stands negated with the relative performance catching a bid - a breakout on the underlying matched by relative strength is a positive sign.
- Favorable Rotational Trends (fig 3) - Sitting in the "improving" quadrant, financials, financials have the strongest momentum relative to the broader market.
- Major Banks (fig 4) - BAC's breakout from a 2-month consolidation is promising. JPM is testing all time highs with positive momentum backing a breakout.
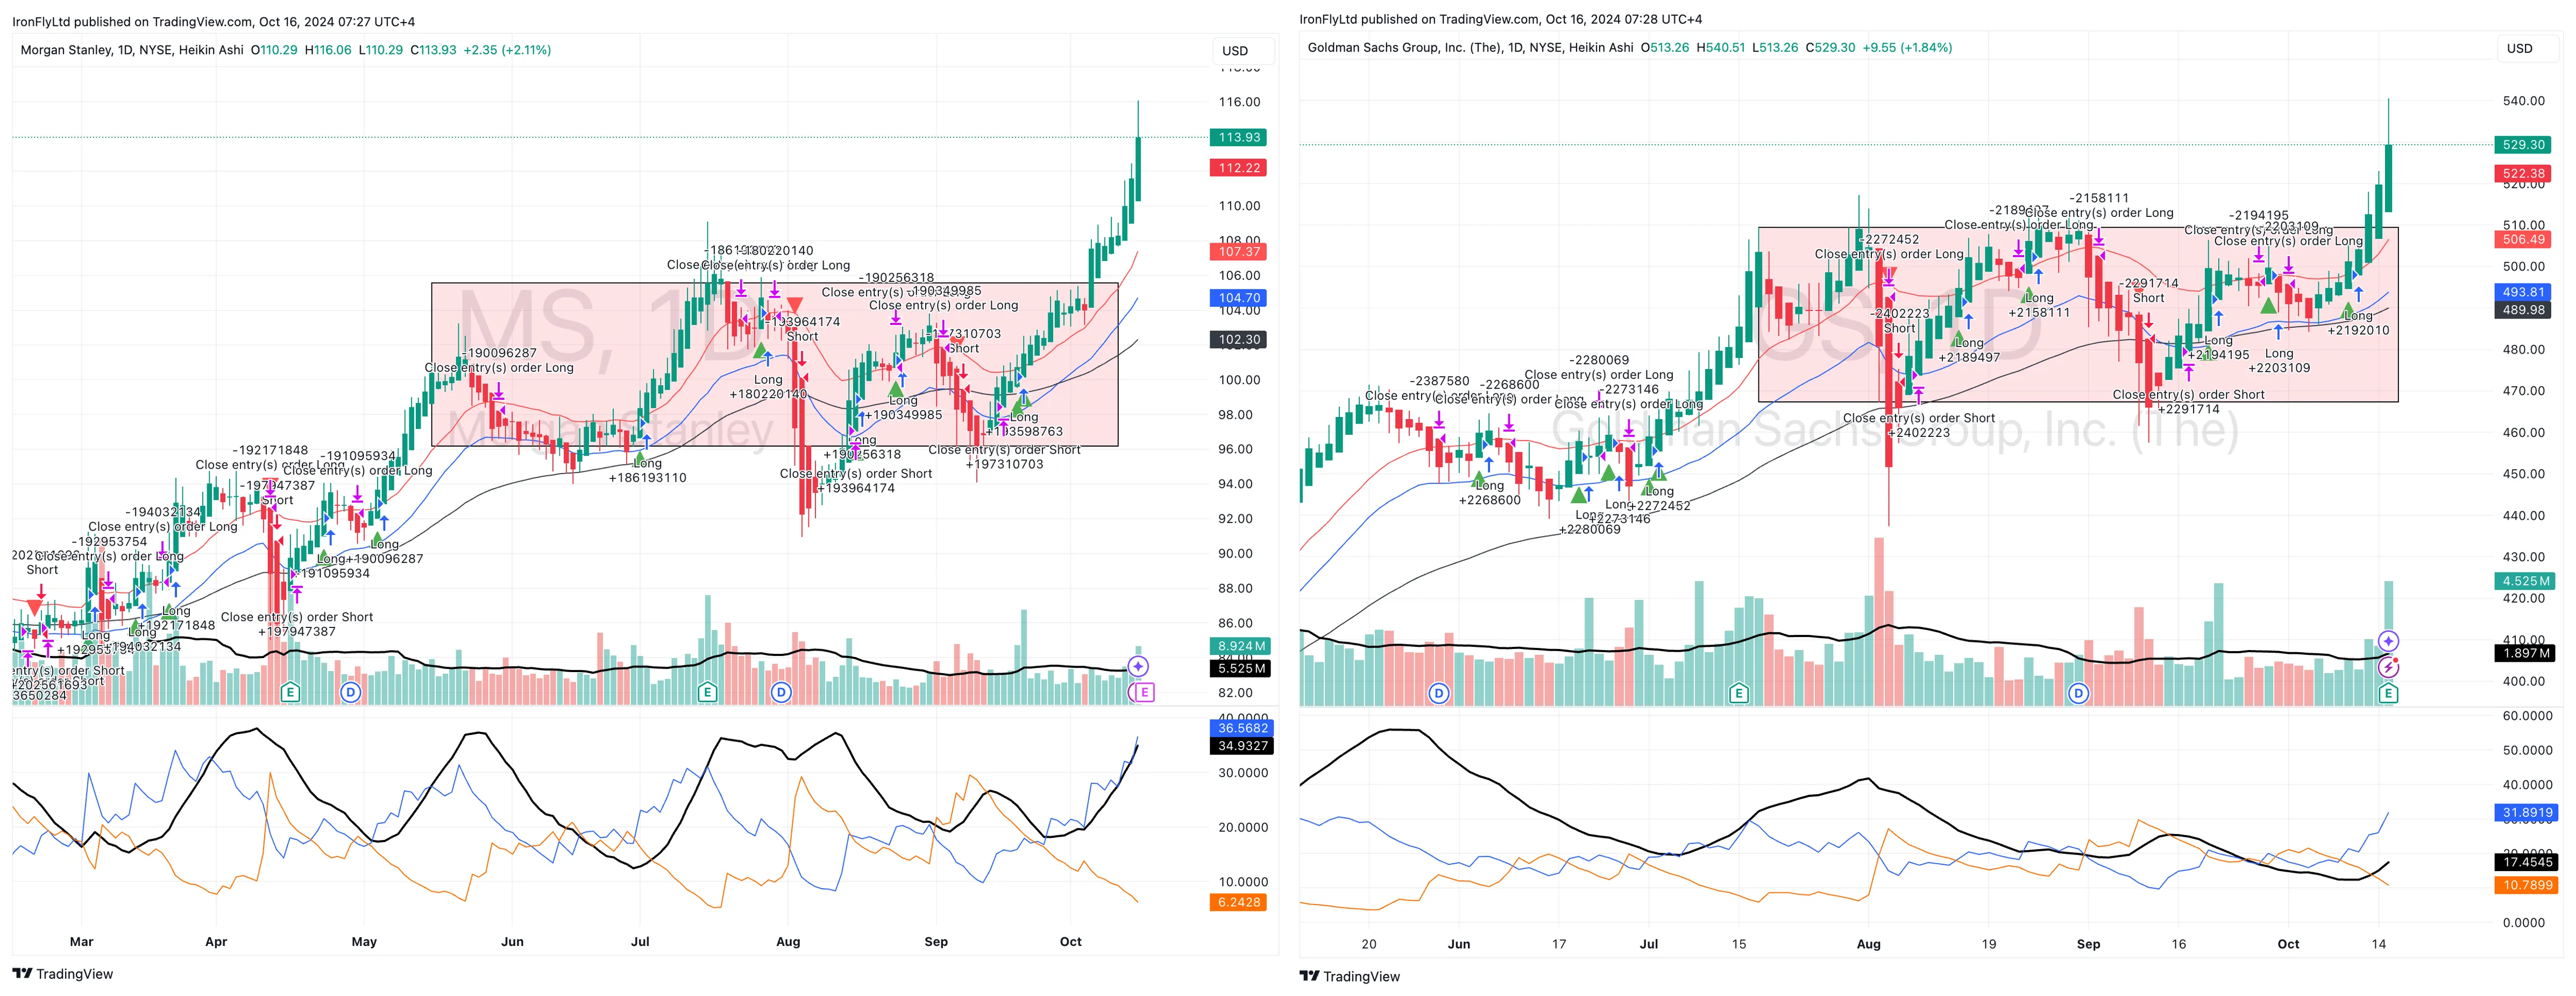
- Investment Banks (fig 5) - Both GS and MS are breaking out after months of consolidation.
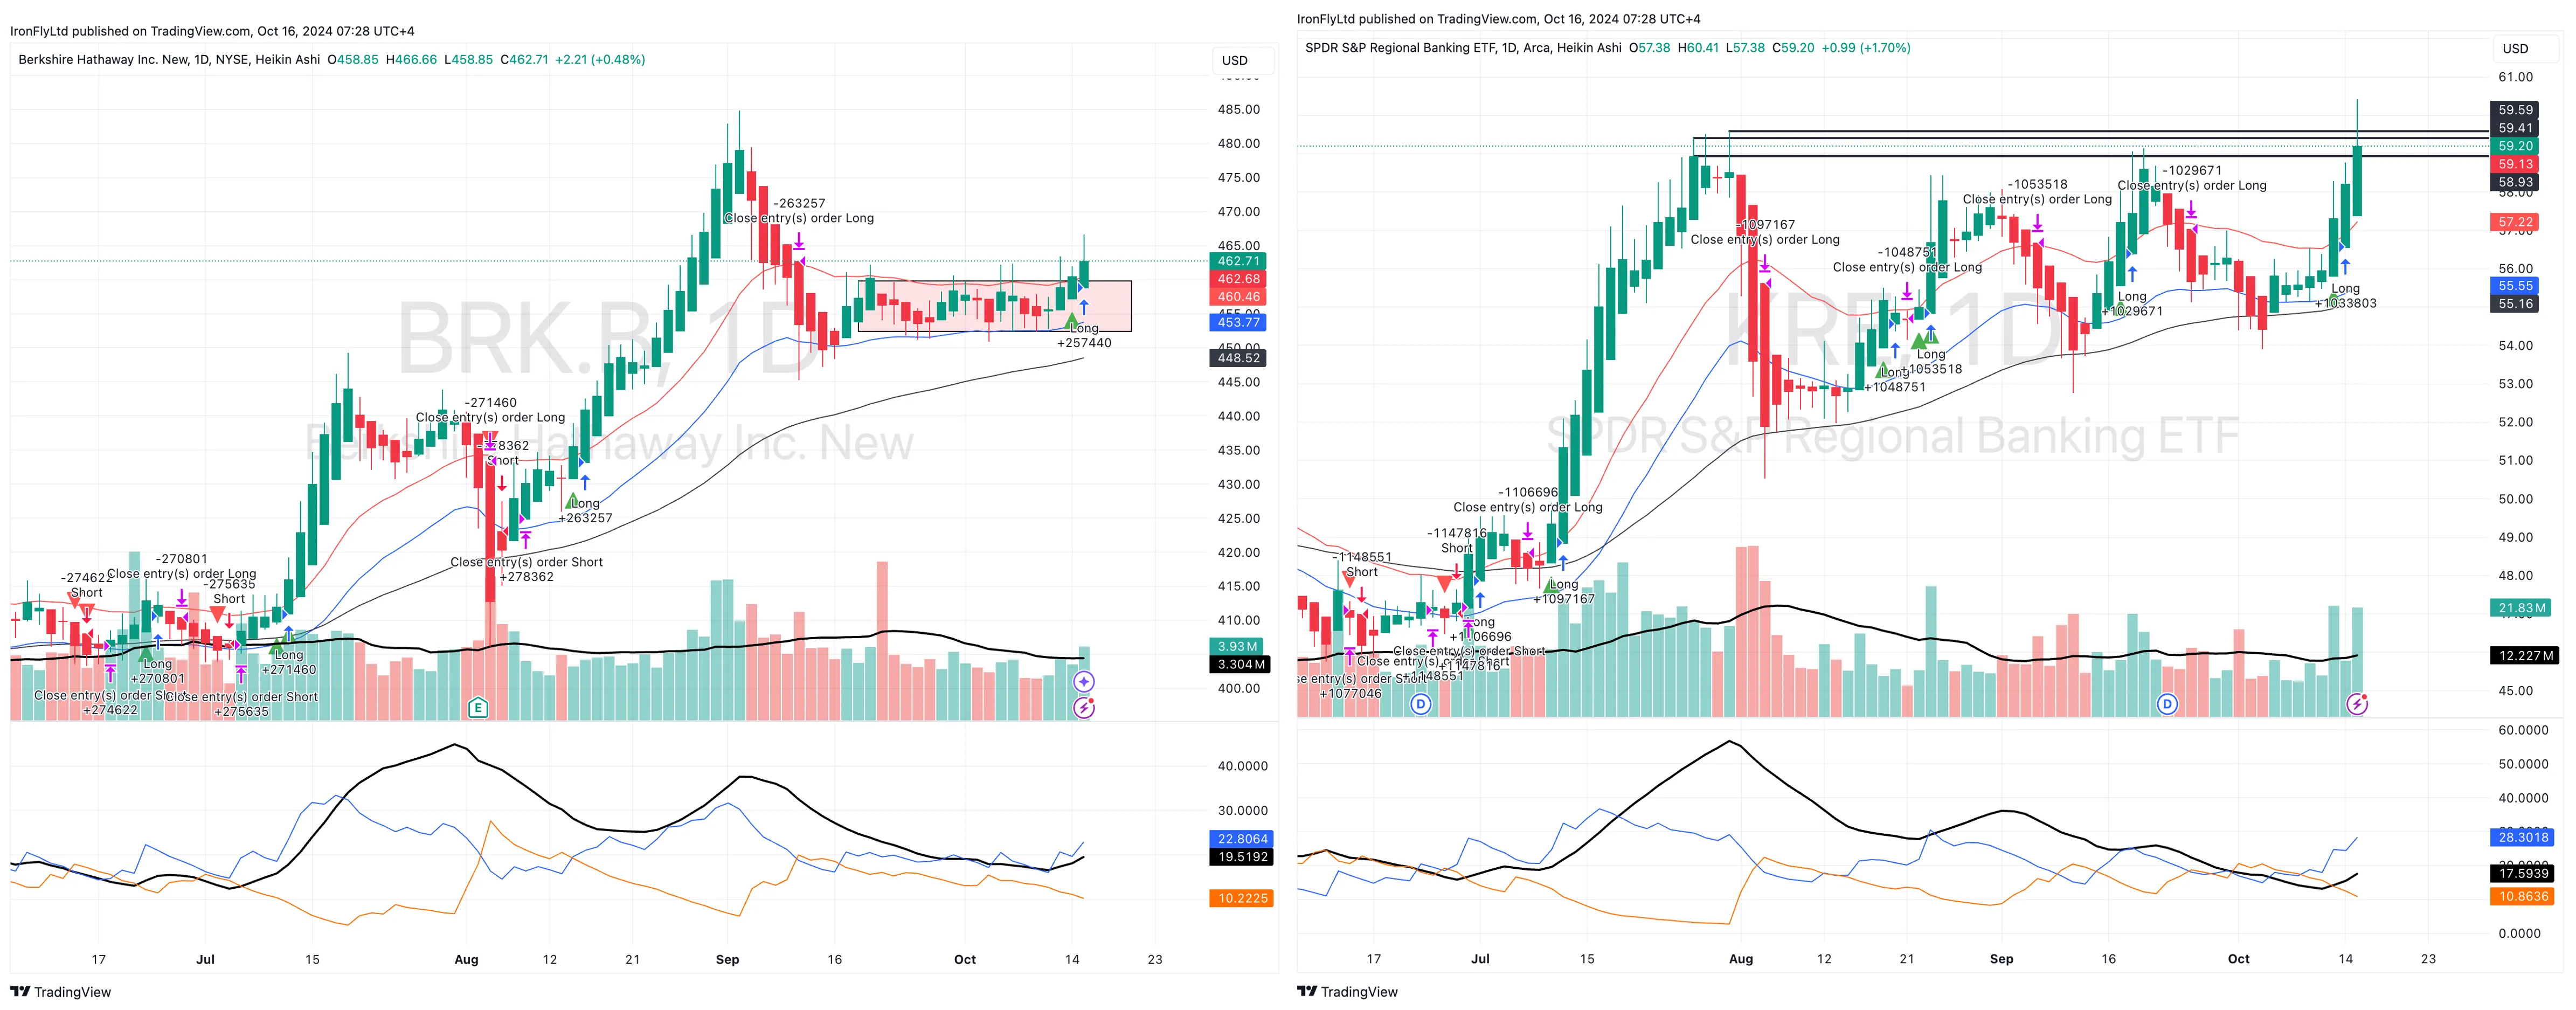
- Regionals joining the party? (fig 6) - KRE's recent rally has brought it to a key resistance level, positive momentum supports a breakout.
Fig 1 - XLF Breaking Out into new Highs
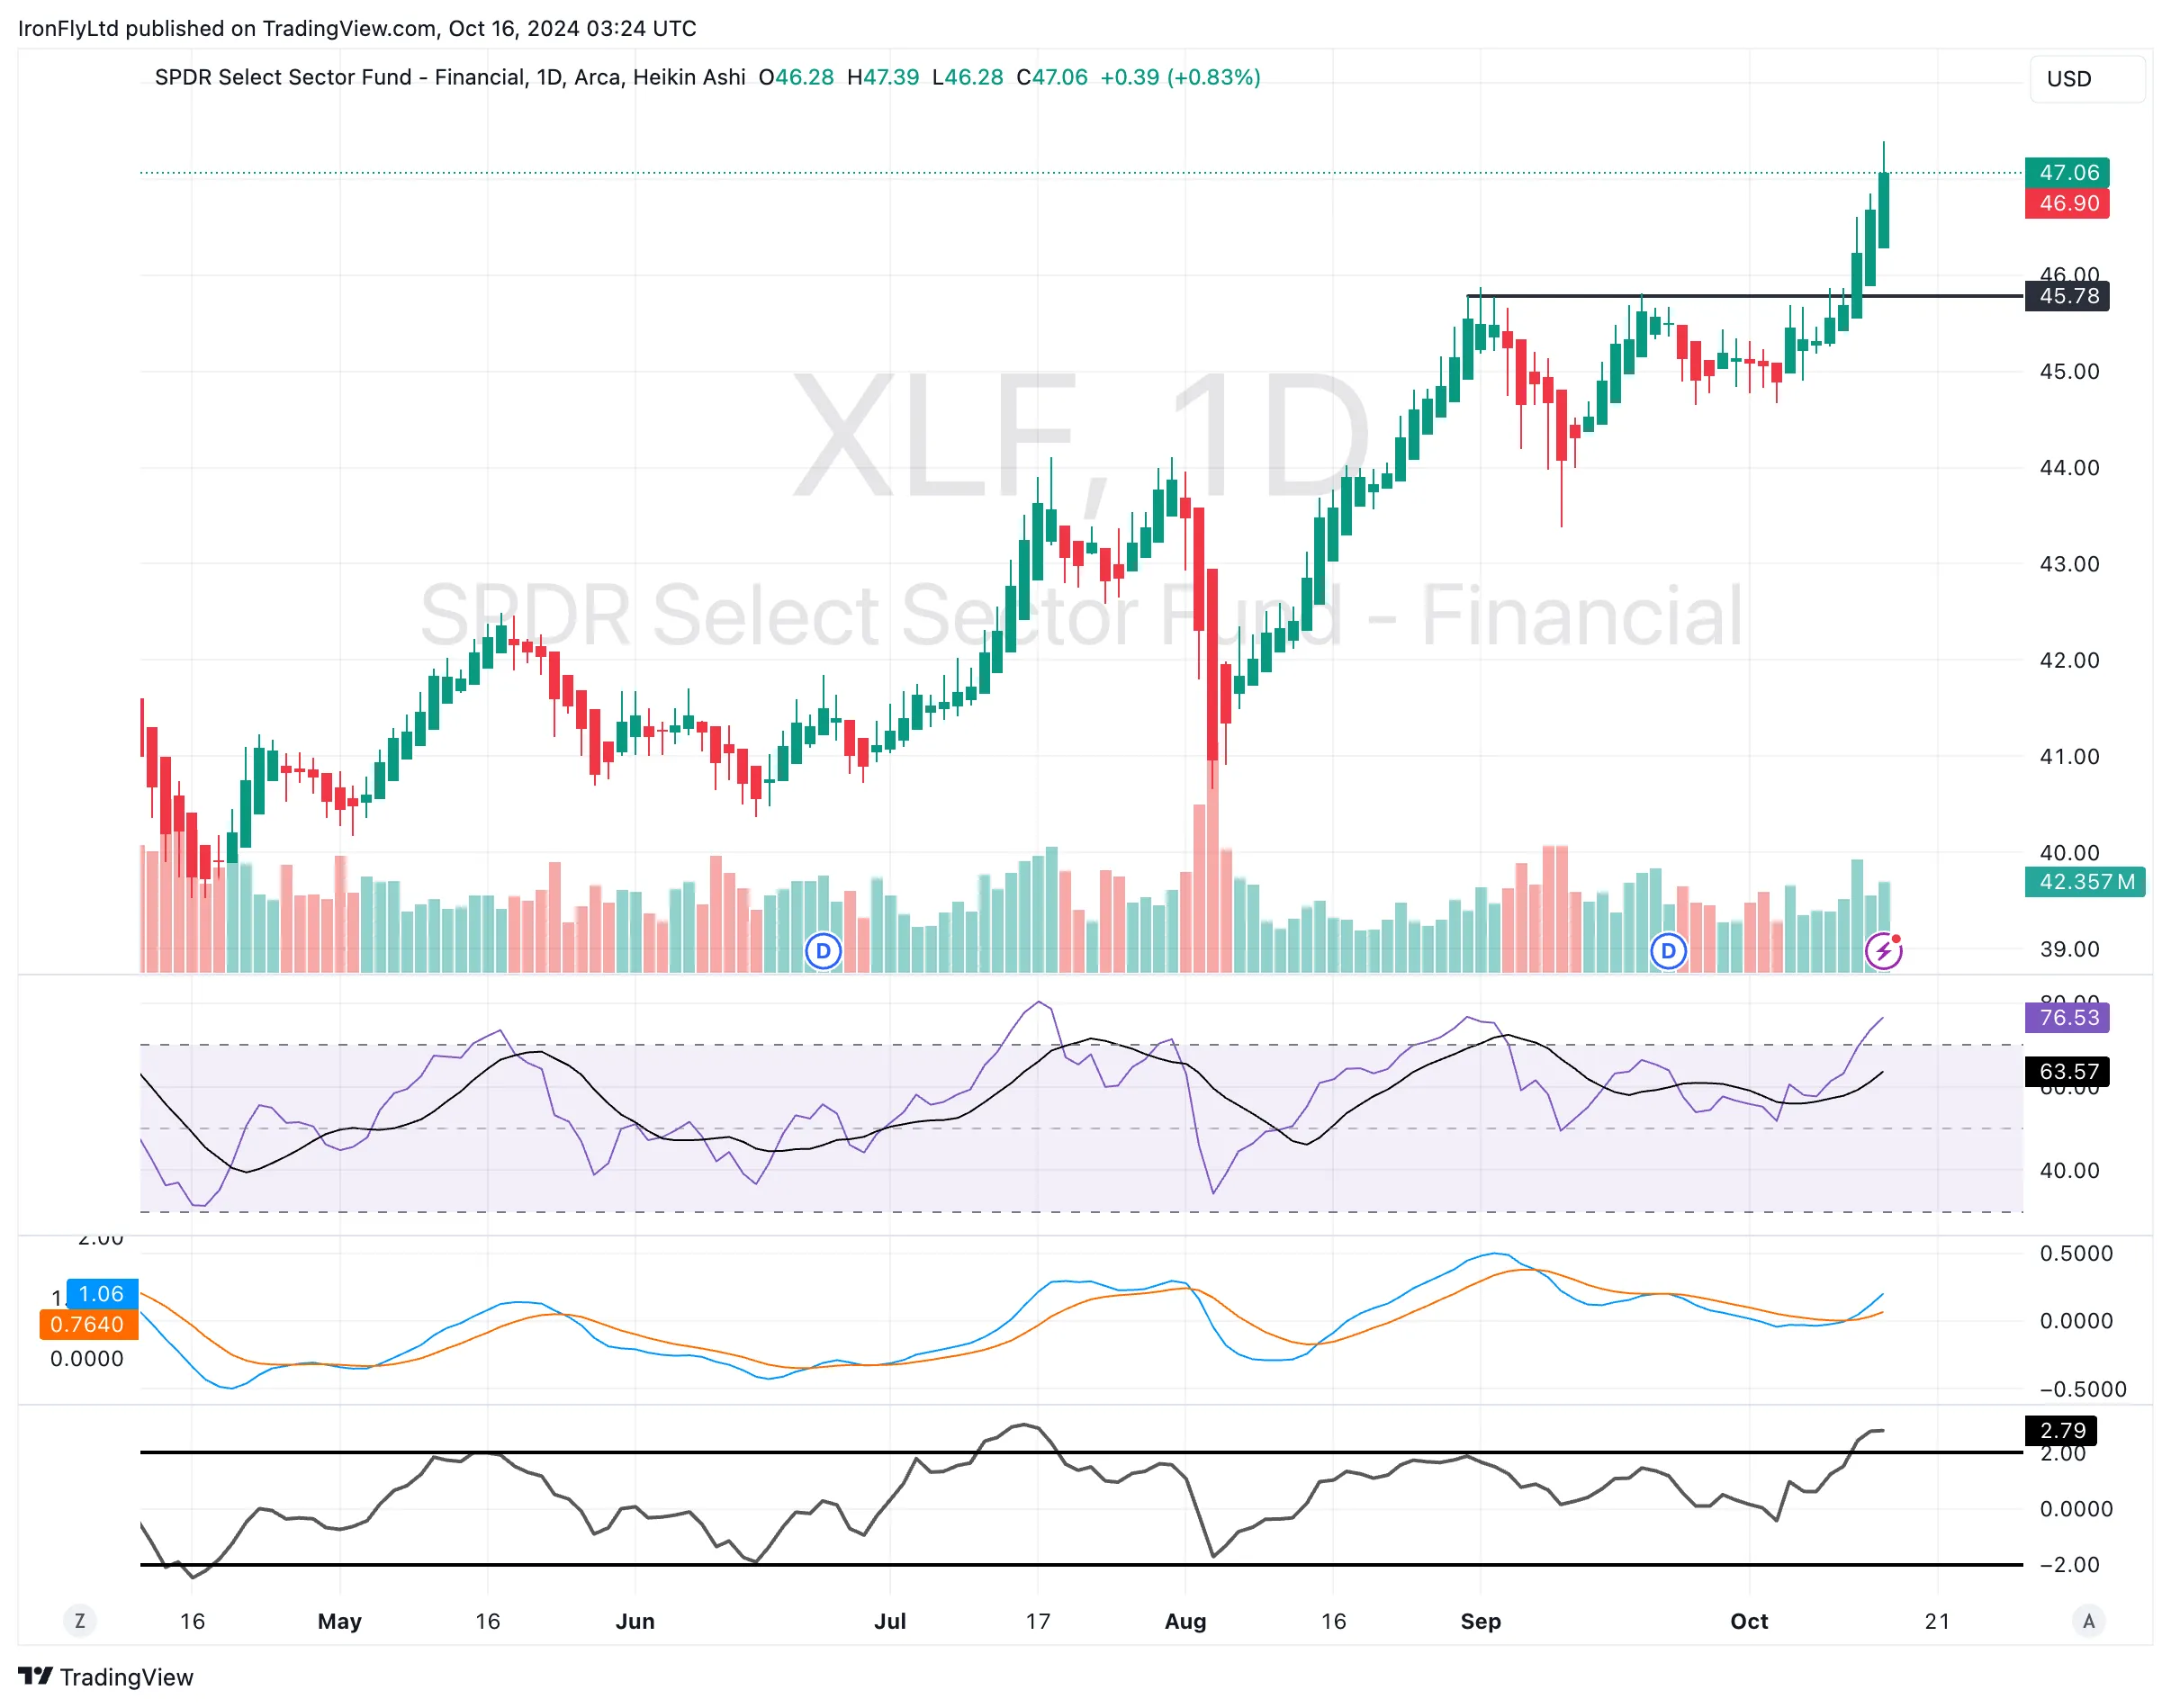
source: Tradingview.com
Fig 2 - XLF, Relative to SPY, Catches a Bid
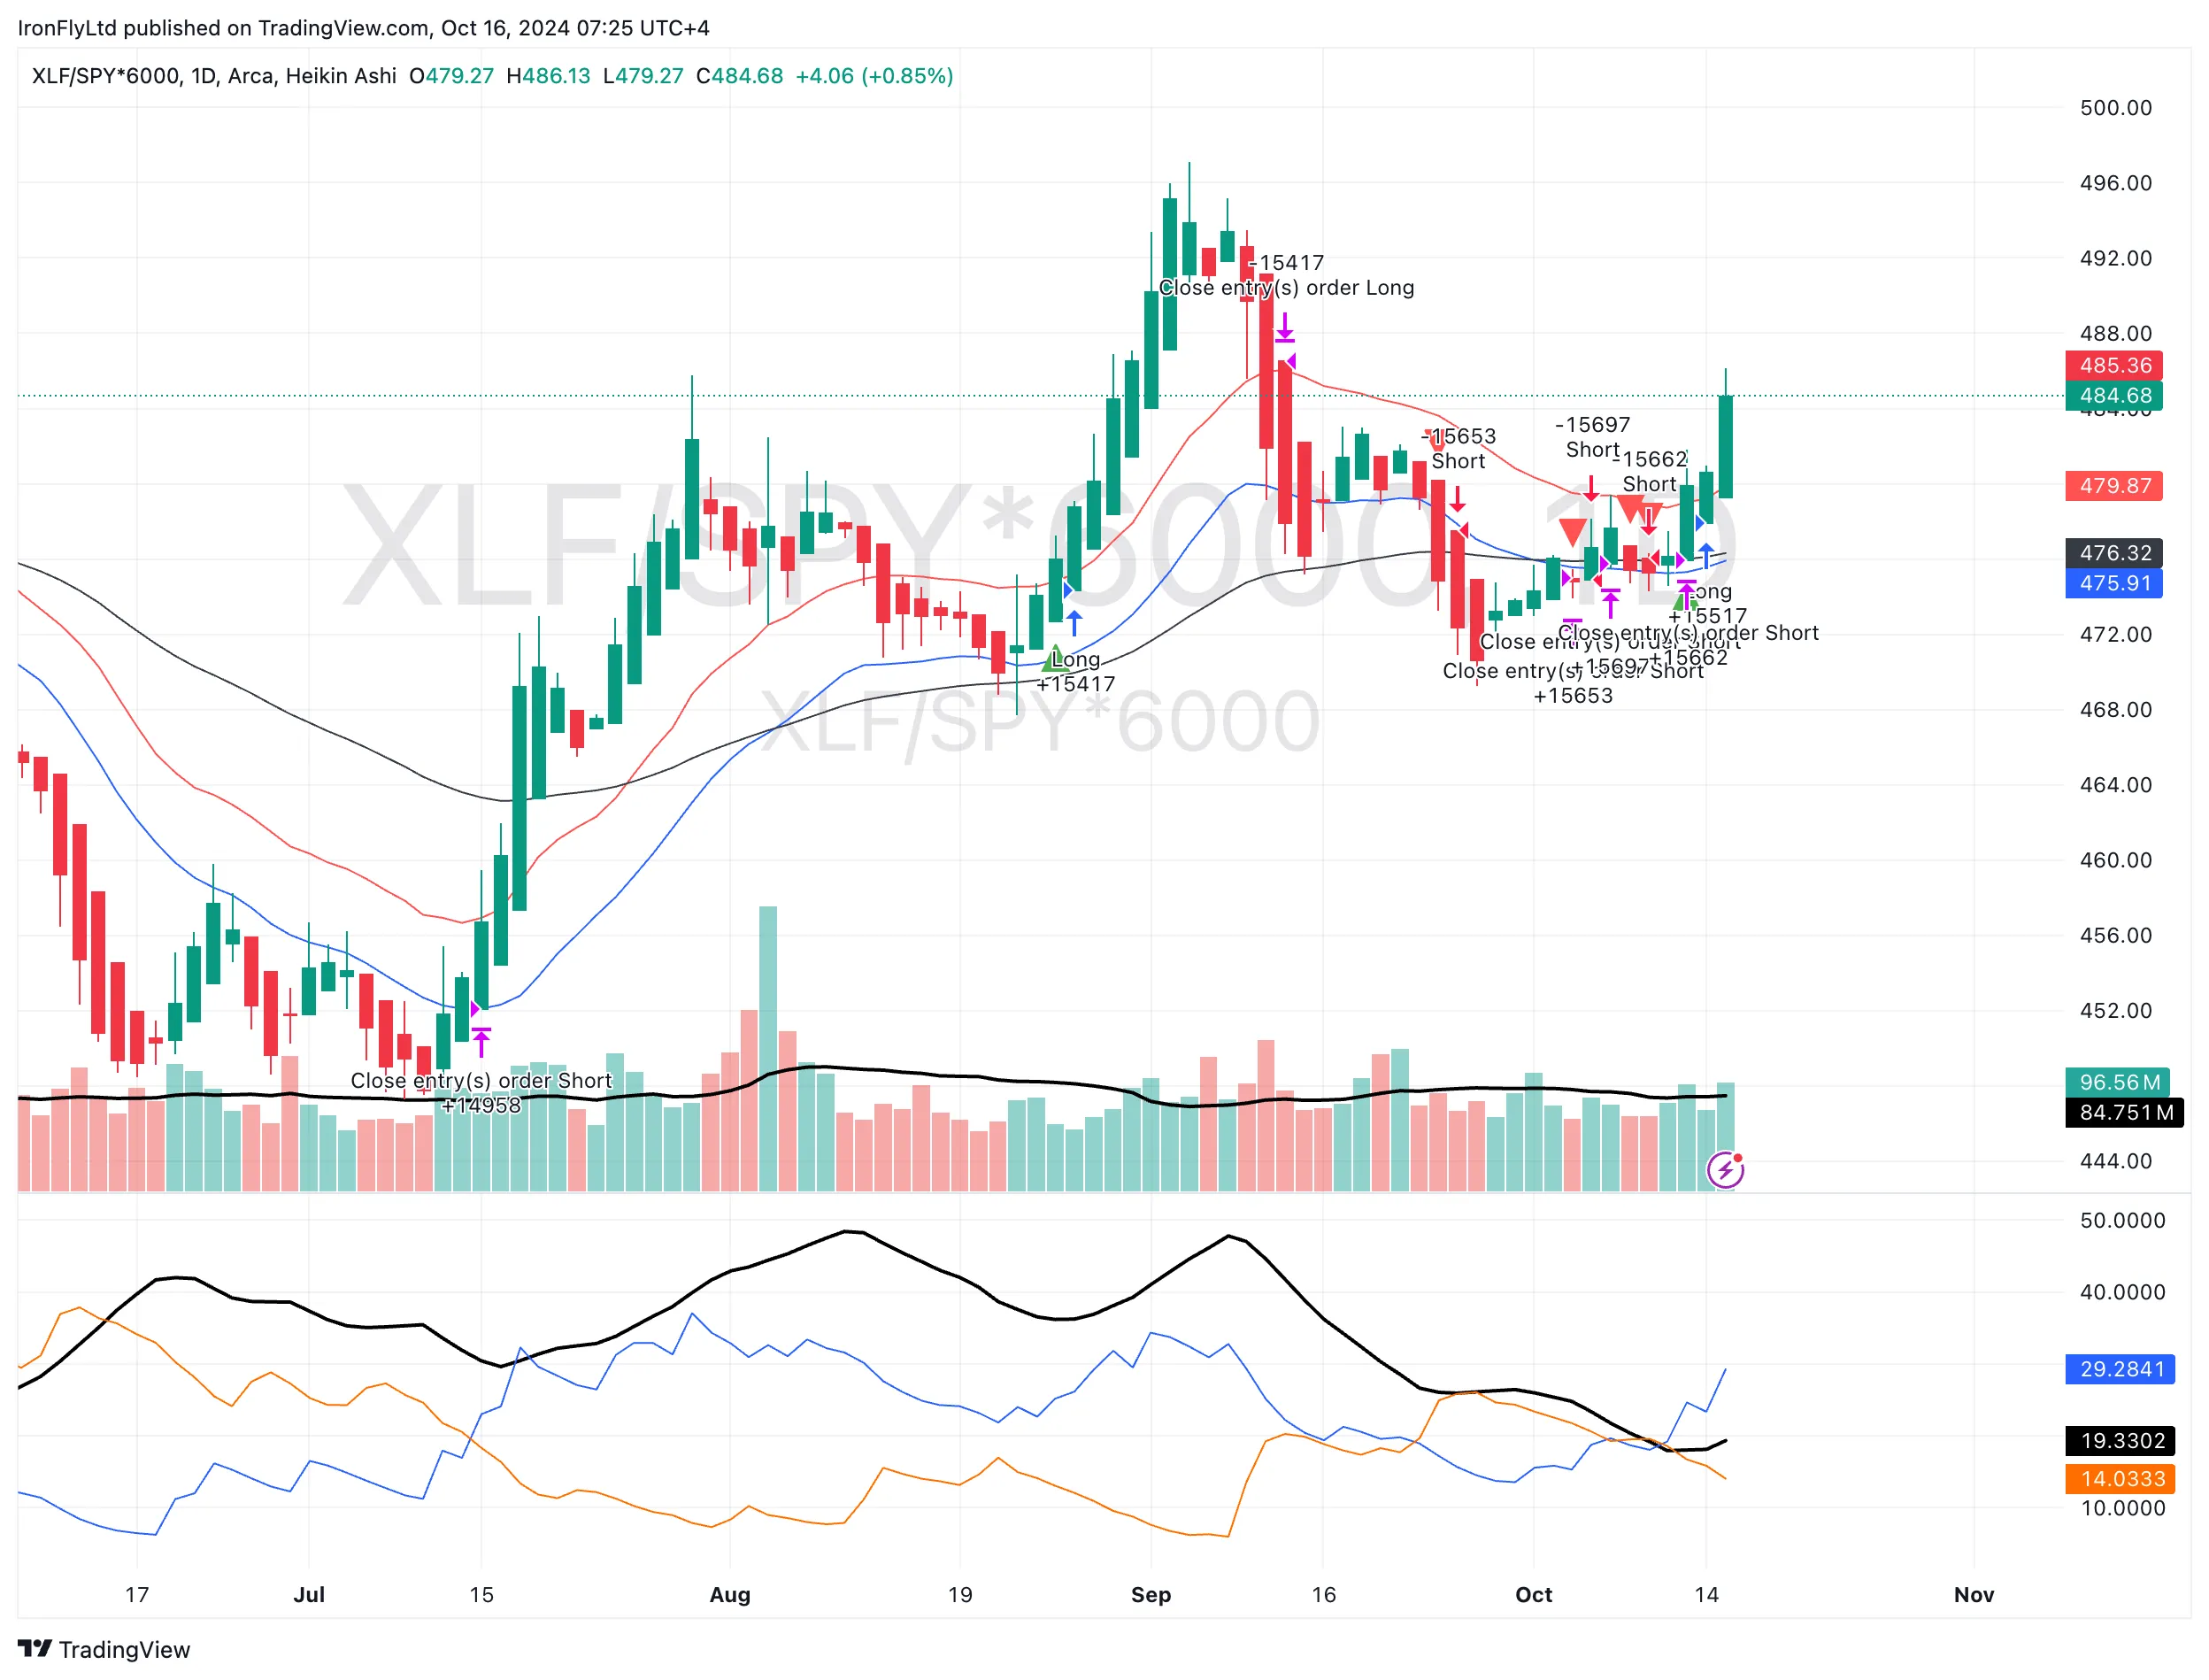
source: Tradingview.com
Fig 3 - Financials - Rotational Trends Are Strengthening
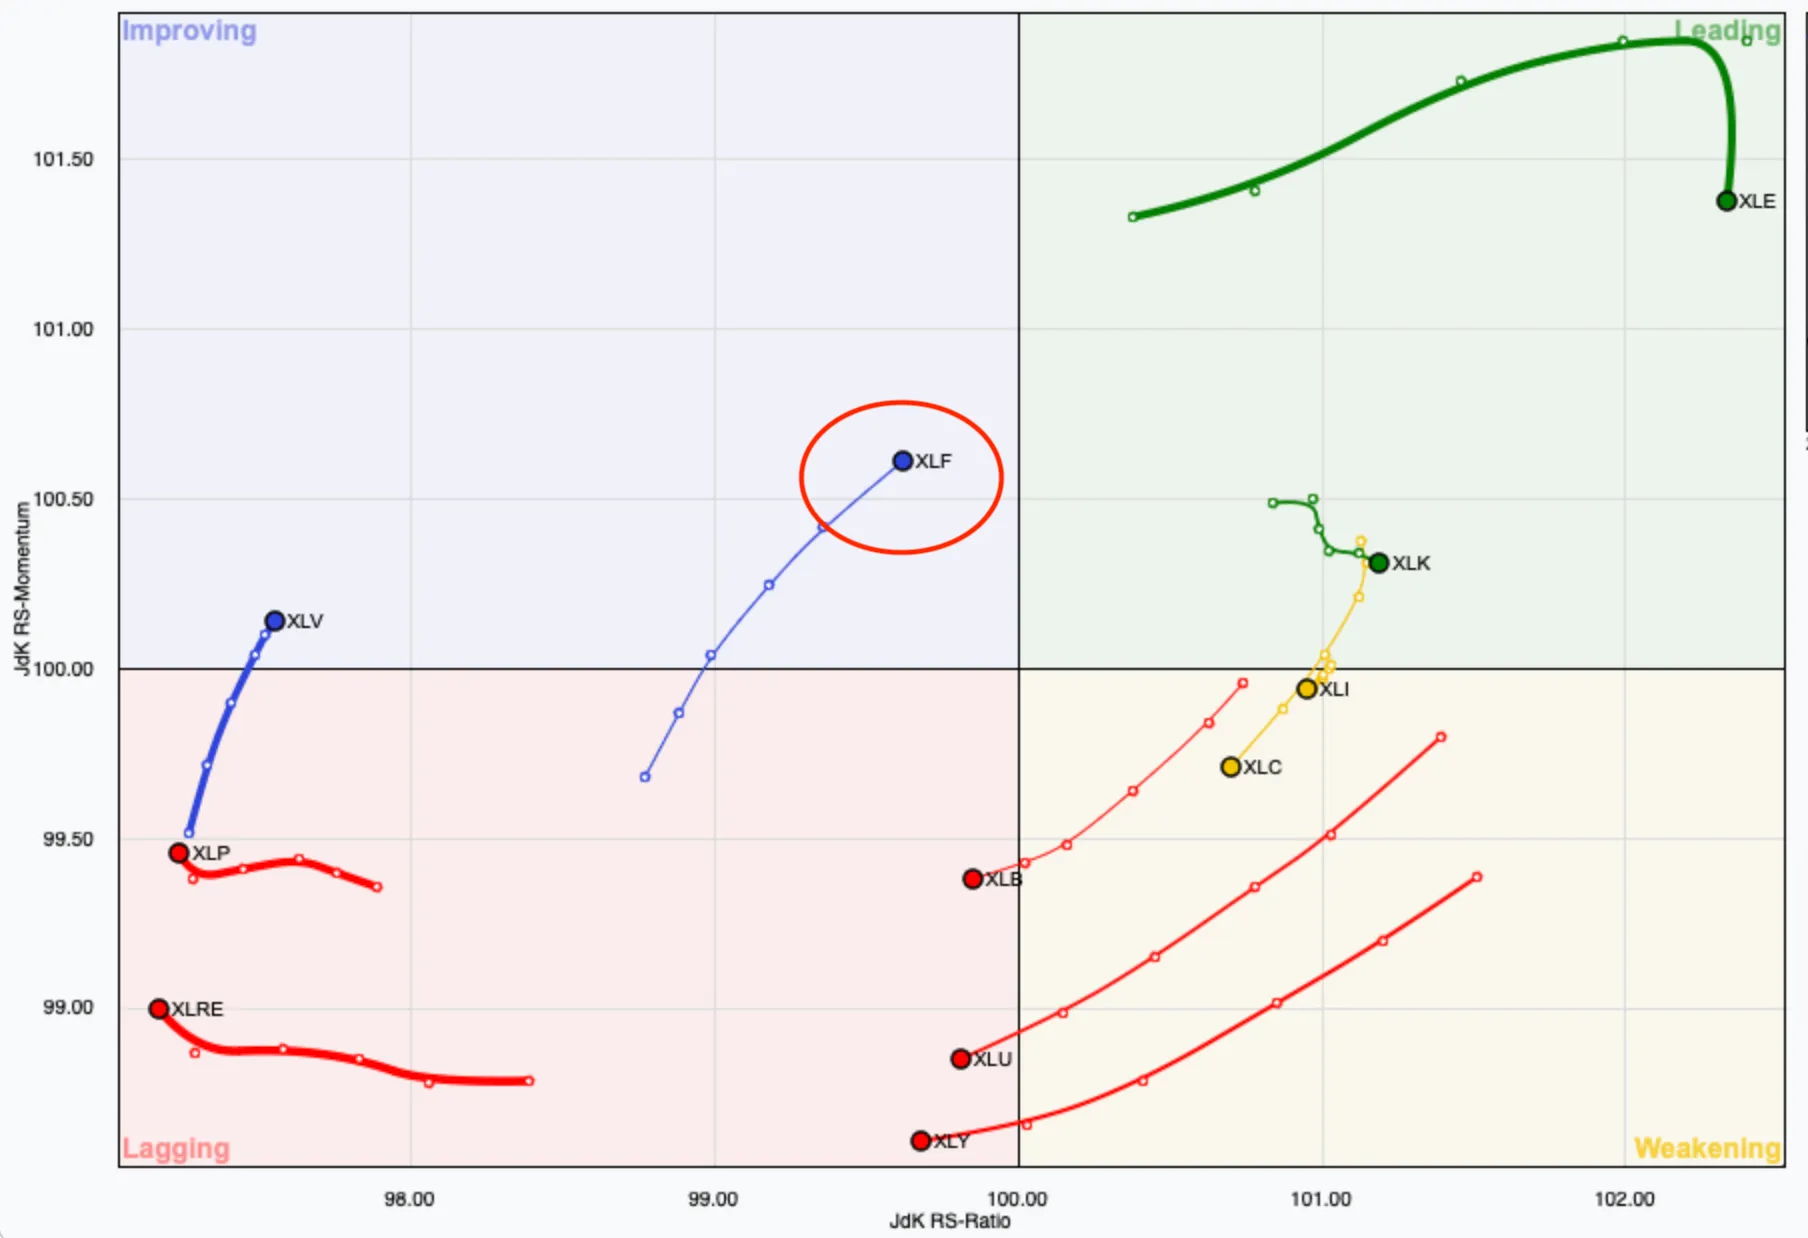
source: Stockcharts.com
Fig 4 - Major Banks - JPM Testing All time High/ BAC breaking Out
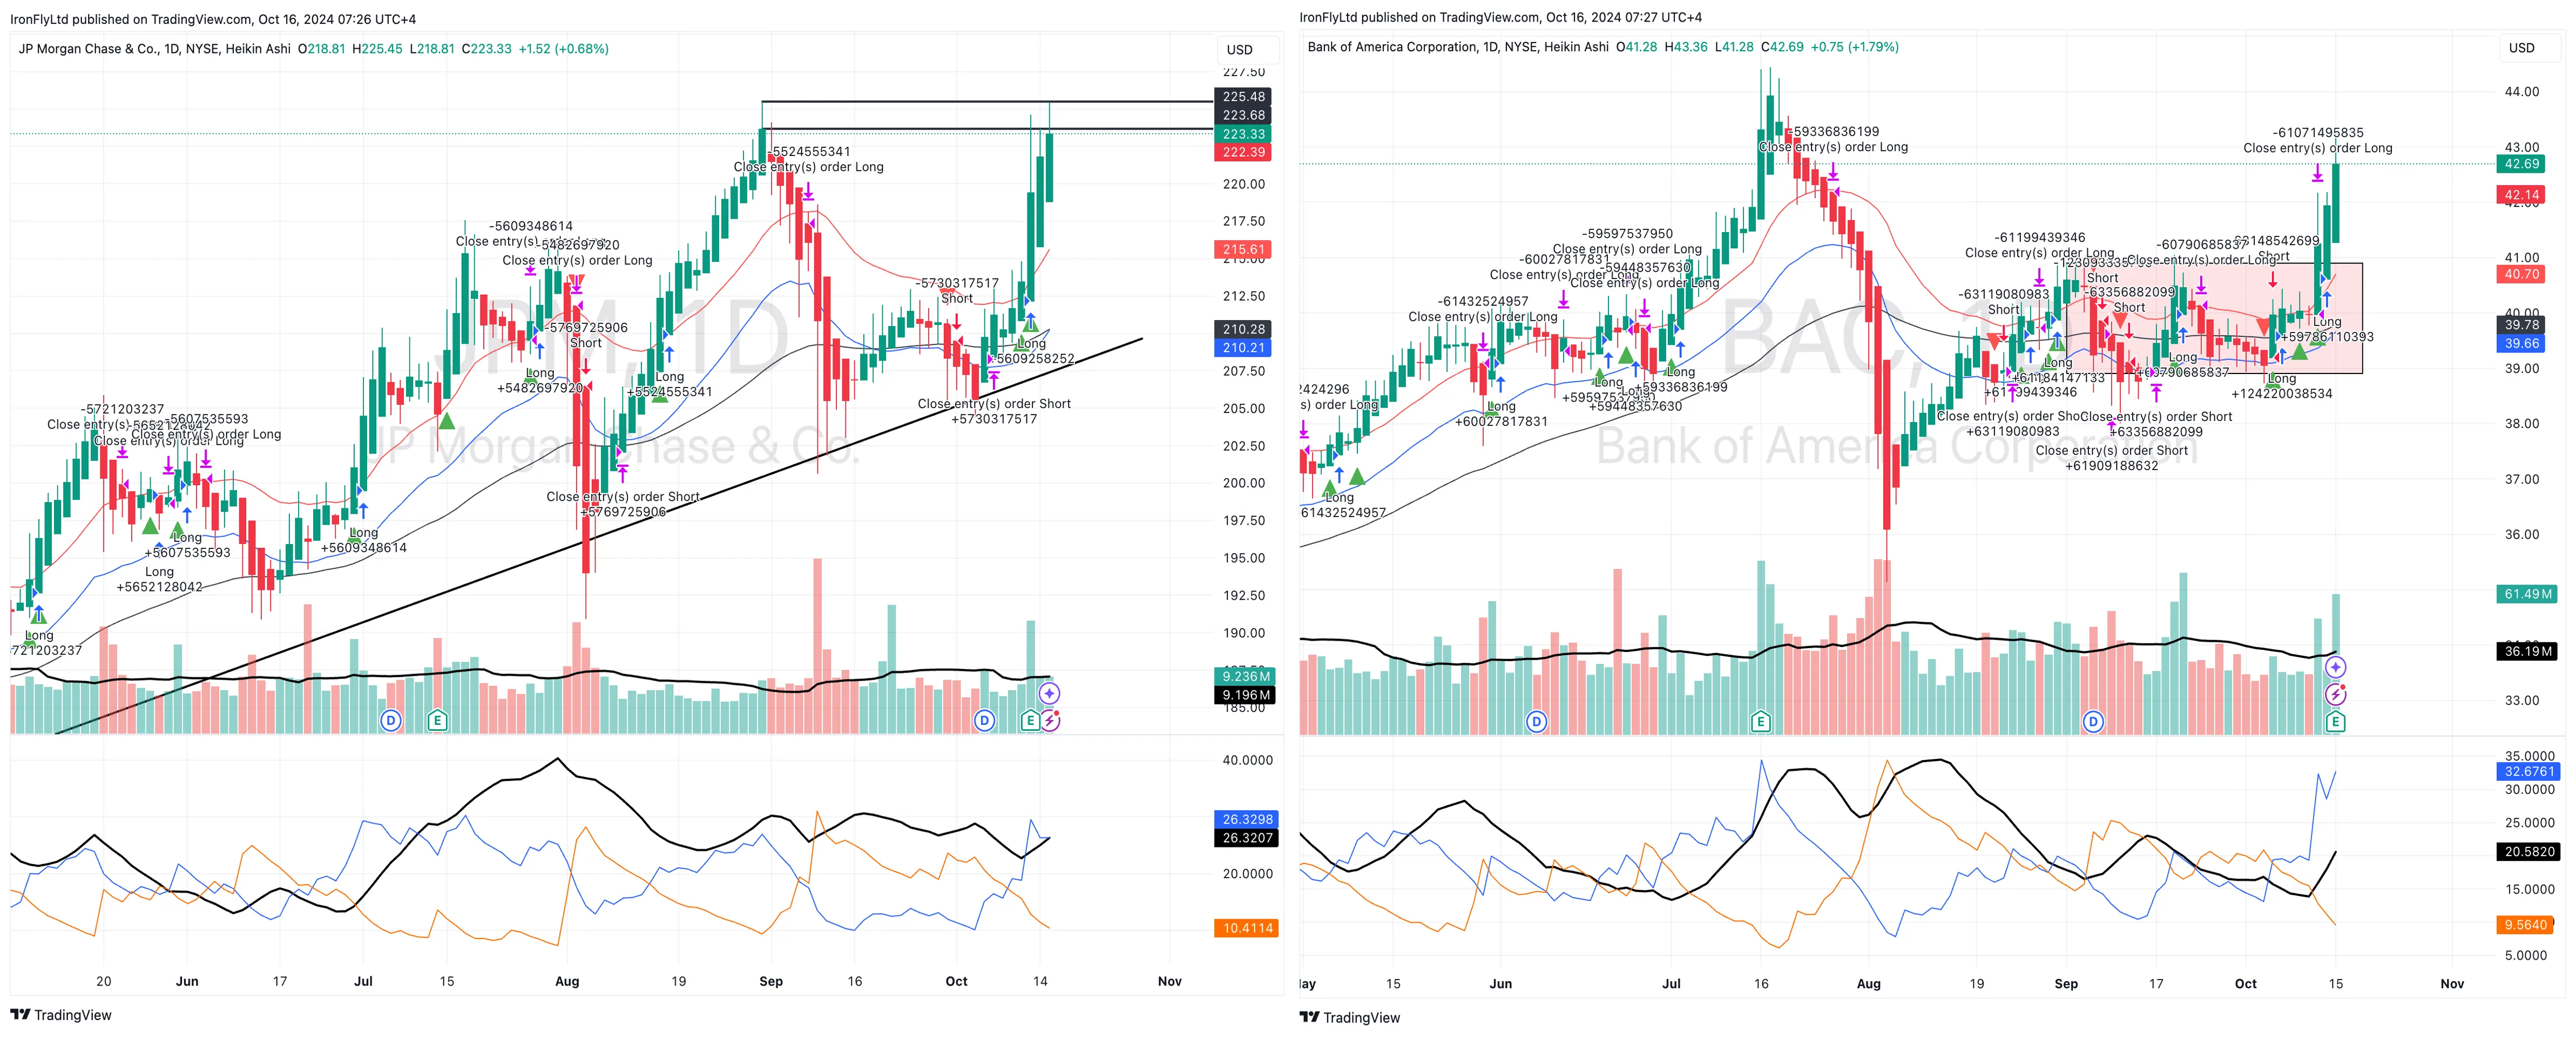
source: Tradingview.com
Fig 5 - Investment Banks - MS and GS Breaking Out
source: Tradingview.com
Fig 6 - BRK - Cusp of a Breakout/ KRE Testing Key Resistance
source: Tradingview.com
No items found.


Subscribe to our Insights & Updates
Thank you! Your submission has been received!
Oops! Something went wrong while submitting the form.


%20(15).png)
.png)